A Dynamic Risk Model for Information Technology Security in a Critical Infrastructure Environment
John H. Saunders
Abstract
The risk
assessment, modeling, and simulation of critical infrastructure
information technology (IT) security has been limited to broad, macro-level
approaches. Concurrently, risk assessment in IT security has been limited to
static analysis and modeling. This paper provides a dynamic risk framework and
a model that synthesizes elements of an organizational decision model on both macro
and micro levels. In the proposed dynamic model the focus is upon building the
reactionary capability of an infrastructure organization as well as preparing
for time-based cascading effects.
Introduction
This
paper begins by describing threats to the infrastructure community in
information technology security. It then relates countermeasures for reducing
those threats. A framework for balancing the countermeasures against the
threats over time, given limited resources, is proposed. Finally a practical
model is demonstrated which allows the architect of an information security
risk policy to target a desired level of risk.
Information Security Threats
How difficult is it for a person or persons with evil intent to break into the IT system of an infrastructure provider such as an electrical utility, a transportation control center, or a health provider? First readers should understand that no IT system is infallible. There are hundreds if not thousands of known methods[1] and tools for attacking information technology systems. These methods exploit vulnerabilities, i.e. weaknesses in hardware, software, and people. Examples of vulnerabilities in these areas include communications line taps, software buffer overflows, remote procedure calls, poor passwords, and untrained system administrators. Many tools and checklists are available for discovering these vulnerabilities. Unfortunately the same tools that are available to the “white hats” are also readily procurable by the “black hats.”
Examples of these tools include scanners, script kiddy tools, sniffers, and rootkits. A scanner tool such as SuperScan looks for open “ports” (like open windows in a house) on a machine such as a network server. When a port is found the attacker is alerted. The attacker can then use the open port to explore the machine. If a program such as Trivial File Transfer Program (tftp.exe - often installed by default with the computer) is on the machine then the intruder can deposit a “Trojan horse” piece of software such as Back Orifice 2K (BO2K). Pieces of software like BO2K are known as “script kiddy” tools because they simple to use. Even a fairly naïve user can craft harmful attacks with them. An insider can run a sniffer such as Ethereal from any computer on a network. The program is configurable to sit and wait for a user to log on and then grab their password[2]. A root kit such as Linux Rootkit 5 is used to replace common low-level routines on computers with bogus copies that have been modified to report information back to their propagator or report false information to the valid user. The more sophisticated rootkits can redirect calls to other programs and then cover their tracks. The more famous “malware” incidents such as the ILOVEU, Code Red, and NIMDA “worm” type viruses exploited vulnerabilities in email systems. There are toolkits for constructing these types of viruses as well.
Most of these vulnerability discovery tools have valid uses for network engineers. The same tools used by the hacker may be used to help engineer’s measure traffic, pull out certain kinds of digital traffic for more efficient routing, or to discover security leaks in networks. Other tools such as virus creation toolkits are marketed as being aides for assisting security engineers in learning how vulnerabilities are exploited. Complicating the job of the network security engineer is the daily release of new software and hardware. New releases yield new targets. At the same time many systems give out “telling” information about their configuration by default. Prior to early 2002 versions of Microsoft Windows 2000 Server automatically opened up many very vulnerable services such as the Internet Information Service, and the Domain Name Service. If you bought and installed this software, this was akin to living in a home without any locks on the doors or windows.
Readers interested in
knowing more detail about these specific methods and tools should refer to the
SANS Institutes Reading Room at http://rr.sans.org. Or readers may also visit Computer Security Links at http://www.johnsaunders.com/security.htm. There you will find links to categories of Attacks
as well as links to Databases filled with Vulnerabilities. Another excellent
resource for learning about vulnerability analysis is the National Institute
for Science and Technology’s publication 800-42 Guideline on Network Security
Testing.
The Challenge - Specific
Vulnerabilities and Threats to Infrastructure Sensor and Control Systems
Given that many threats to general networks exist, what
impact might this have on the specific types of Control Systems (CS) such as Supervisory Control and Data
Acquisition (SCADA) Networks used by critical infrastructure organizations?
Aren’t these systems typically more isolated and have specific versus general
purposes? In this paper we will refer
henceforth to the entire “operational” systems used by infrastructure
organizations as SCADA. In truth there is an alphabet soup of many IT elements
within this umbrella. These include sensors, valves, logic controllers,
switches, intermediate “intelligent” devices, communications lines as well as
full-scale computers and computer networks. Since the early 1990s there have been many movements toward
standardizing protocols[3]
for SCADA Systems. Examples include the Utility Communication Architecture
(UCA), the International Electro
technical Committee’s (IEC) selection of TCP/IP as the mandatory networking
protocol for intra and inter substation communications, and selection of the
Manufacturing Messaging Specification (MMS) as an application layer standard
for services to read, write, define, and create data objects. It is important
to understand that this standardization movement presents a new set of risks to
the critical infrastructure community.
There are two general areas where different types of vulnerabilities exist in control systems. The first is in legacy systems, which are patchworks of controls put in place over decades of IT materialization. The second is the newer emergent systems that are focused upon standard configurations. The good news for the much older legacy control equipment is that these systems are relatively safe from attack by outsiders. The logic in these systems tends to be hardwired and/or proprietary. However these systems do tend to be more vulnerable in terms of physical exposure – that is located at remote sites in boxes that may be easily compromised and accessed through easily accessible low-bandwidth modems. The greater threat may be from insiders who understand the simpler hardwired nature of the equipment and have ready access.
As in any industry IT has provided the infrastructure industries with emergent options in doing business. The table below provides in insight into the emerging IT related technology along with the associated vulnerability and threat agent.
|
Table
1. Computer Security Challenges in the SCADA Environment |
|
|
What
is occurring in infrastructure industries |
What
is occurring in information security (IS) |
|
Quantity
and Extent of Supervisory Control and Data Acquisition (SCADA) Systems |
Most
hacked: Critical Infrastructure |
|
Move
toward standardized platforms, e.g. Windows 2000 |
Most
Vulnerabilities: Microsoft, esp. web based software |
|
Move
toward Internet Protocol (IP) and System Network Mgmt Protocol (SNMP) as a
base for Communication & Management |
Easiest
protocols to hack: IP & SNMP |
|
Move
toward greater connectivity especially to business type networks e.g. for
billing |
Opportunities
for Access: Increasing |
|
Wireless
connectivity |
Best
mode for easy & unprotected access: Wireless |
|
Constrained
& highly controlled IT resources |
Information
Security Resources: Very Complex, Difficult to manage, significant emerging
technology |
|
Difficulty
in locating IT personnel |
Of all
IT professionals: security
professionals rare, expensive |
Many of the IT changes occurring in the infrastructure arena
are good business decisions and provide benefits to the user community. Using
IT to help sense and/or control the flow of water or electricity provides
efficiency and economy in operations. A move toward common IT platforms such as
Microsoft Windows running on Intel chips allows an organization to quickly
install computer programs which integrate components of their infrastructure.
At the same time using common data communications protocols such as the
Internet Protocol (IP) and the System Network Management Protocol (SNMP) also
allows infrastructure components to communicate freely.
But as these changes occur, they introduce new vulnerabilities.
Dr. Samuel Varnado of Sandia Labs has highlighted
some of these[4].
“Sandia has been investigating
vulnerabilities in SCADA systems for five years. During this time, many have
been found. Our assessments show that security implementations are, in many
cases, non-existent or based on false premises.” “Some of the vulnerabilities
in legacy SCADA systems include inadequate password policies and security
administration, no data protection mechanisms, and information links that are
prone to snooping, interruption, and interception. When firewalls are used,
they are sometimes not adequately configured, and there is often “backdoor”
access because of connections to contractors and maintenance staff. We have
found many cases in which there is unprotected remote access that circumvents
the firewall. From a security perspective, it should be noted that most of the
SCADA manufacturers are foreign-owned. In summary, it is possible to covertly
and easily take over control of one of these systems and cause disruptions with
significant consequences. Recognition of that fact led numerous federal
agencies and municipal water and transportation systems to request Sandia help
following September 11. Of even more concern is the fact that the control
systems are now evolving to the use of the Internet as the control backbone.
The electric power grid is now, under restructuring, being operated in a way
for which it was never designed. More access to control systems is being
granted to more users; there is more demand for real time control; and business
and control systems are being connected. Typically, these new systems are not
designed with security in mind. More vulnerabilities are being found, and
consequences of disruptions are increasing rapidly. Industry is now asking for
our help in understanding vulnerabilities, consequences, and mitigation
strategies.”
Specific lists of vulnerabilities for Computer Off the Shelf (COTS) equipment may be found at CERT or at Security Focus.[5] At these same locations you will find suggested methods for countering the highlighted vulnerability.
Available Countermeasures
While the bad news is that threats
and threat agents are ubiquitous, the good news is that, for every known vulnerability, there is a matching
countermeasure. The caveat is that not all vulnerabilities are known. The table below outlines thirty-one general classes of
countermeasures that may be used to fight specific vulnerabilities or as a
combined general fortress against possible new attacks.
|
Table 2. Countermeasures for
Information Security Vulnerabilities |
|
|
People •
Formal
Written Policy •
Background
Checks •
Incident
Response Team •
User
Safety & Response Training Processes •
Updating •
Secure
Software Configuration •
Backups •
Log
File Analysis •
Physical
& Environmental Security Authentication
& Access •
Biometrics •
Passwords
and Tokens •
Database
Access Control •
Server/Segment
Access Control Computer
Level •
Antivirus
Protection •
Web
Browser Controls |
•
Operating
System Controls •
Redundant
Hardware or Software Network
Technology •
Firewalls
/ Router Security •
Intrusion
Detection Systems •
Disconnect •
Integrity
Checking •
Honeypots Encryption •
Digital
Certificates •
Virtual
Private Networks •
Database
Encryption •
Wireless
Equivalency Protocol •
Pretty
Good Privacy (PGP) E-mail Management •
Adequate
Budget •
Effective
Personnel Function •
Contingency
Planning •
System
Audit & Vulnerability Analysis |
A number
of general recommendations for combating SCADA vulnerabilities have been
developed by the federal government [US Department of Energy, 2002]. Examples
from these recommendations include “Identify all connections to SCADA
networks,” “Disconnect unnecessary connections to the SCADA network,” and
“Establish strong controls over any medium that is used as a backdoor into the
SCADA network.” It seems apparent that more work needs to be done to identify
those issues specifically associated with SCADA type systems. As such the
Federal Government through the National Institute of Standards and Technology
(NIST) has commissioned the Process Control Security Requirements Forum
(PCSRF).[6]
This group has members from government and industry supporting the development
and dissemination of standards for process control security.
The challenge facing an information security manager is to apply the best available set of countermeasures given available resources – people, technology, funding, and time. The manager must minimize Residual Risk, i.e., that portion of risk that remains after security measures have been applied. Unlike many other areas of IT management, an important consideration in managing information security is time.
The Importance of a Time
Focus in Counteracting Threats
The importance of
reaction time, automated or manual tends to take on greater meaning in SCADA
systems than in more traditional networks. Downtime and reaction time in
an infrastructure organization may create critical, life-threatening,
situations. For some infrastructure components such as programmable logic
controllers (PLC), a fraction of a second may be the unit of concern. That’s
the time required to toggle a switch. In an electrical system, a malfunctioning
or mis-programmed switch may lead to the buildup of current and an eventual
explosion. The short-term time focus is why there is such a large
emphasis in many networked environments on automated countermeasures such as
firewalls and intrusion detection systems. These systems can be set up to check
every incoming (and outgoing) piece of data on a “real time” basis. If the
signature of an attack is known, then the countermeasure can halt its progress
and provide an alert to human operators.
There
are many time frames beyond an emergency level that should be considered. For
other components, such as placing a generator into service, the lead-time may
be months or years. During that extended time an entire community may suffer. The table below provides a framework for better
understanding the time frame relationships.
|
Table 3. Time Components in
Information Security Implementation |
||
|
Reference Time |
Definition |
Examples / Countermeasures |
|
Emergency
– seconds to hours |
Time to
deal with real time emergencies – component & system crashes, denial of
service attacks |
Emergency
response teams & procedures; Backup systems; side channel communications
lines; |
|
Update
– hours to days |
Time to
insure that announced vulnerability
patches are routinely installed |
Security
patches to Windows 2000; insuring compatibility in device drivers when new
equipment is installed |
|
Long
Term |
Reacting
to keep potential unknown threats at a distance from the organization and its
systems |
Keeping
critical information about systems away from public access; Keeping
operations centers in “quiet” locations; erecting multiple security hurdles -
“Defense in Depth” |
As
threats are increasing gaps in the three areas outlined above need to be
closed.
Given the importance of the time factor, it is essential that it be an integral part of understanding the relationship between threats, vulnerabilities and countermeasures in information security modeling.
Risk Frameworks for Information Security
While it is clear that measures to reduce the risk imposed by the myriad of threats should be taken, just “how” to accomplish this is more of a mystery. Regretfully security is not large on the RADARscope for many organizations. As an overhead cost it is often under funded. Operators are not well trained in security issues. Security crises are poorly handled because response teams have not been established.
The challenge for the IT and Operations managers in this type of environment is to;
1. properly analyze the threats to and vulnerabilities of an information system,
2. identify the potential impact that the loss of information or capabilities of a system would have on the business, and, based upon these analyses,
3. identify appropriate and cost-effective counter-measures.
This challenge is known as risk assessment. Haimes [1998] and others have thoroughly explored the risk assessment process. The framework they have established allows practitioners to analyze and synthesize risk within the following macro level framework.
• Analysis
• What can go wrong?
• What is the likelihood that it would go wrong?
• What are the consequences?
• Synthesis
• What can be done?
• What options are available and what are their associated tradeoffs in terms of all costs, benefits, and risks?
• What are the impacts of current management decisions on future options?
Models created for assessing risk in infrastructure industries such as those proposed by Ezell et al [2000] and by Association of Metropolitan Sewerage Agencies (AMSA) [2002] fit well within this framework. A model that has been produced independently within the IT security community also fits this framework quite well. [Common Criteria, 1999]. This semantic model is shown below.
Figure 1 - Common Criteria Security Model
This model was developed as part of the Common Criteria (CC) effort. The CC Board is an international standards body that has developed common standards for evaluating IT security products. But while it provides a good general framework, the devil lies in the execution of its details.
Risk Assessment Challenges and
Methods
Longstaff et al aptly framed the risk assessment challenge in their statement, “To the extent risk assessment is precise, it is not real; to the extent risk assessment is real, it is not precise” [2000]. In assessing the risk involved in Information Security major questions such as the following need to be addressed:
- What specific variables should be included in the model? How do we represent threats, vulnerabilities, assets, and countermeasures?
- What level of detail is necessary?
- What specific values do we attach to these variables?
- Do these values change over time? If so, how?
- How do we synthesize all the variables? Is there a single entity called risk or multiple aspects? What is the algorithm that is used to determine how we combine the representational elements of threat and countermeasure?
Ultimately decision makers need assistance in determining which countermeasures have the greatest impact. If limited resources are available, how should they be applied to gain the greatest leverage? Do we upgrade our firewalls, do more software testing, apply more funds to security education, encrypt our databases, or do vulnerability testing. The list is endless. Further which do we do first and when?
There are a variety of detail mathematical and/or heuristic approaches toward factoring these multiple objectives in assessing risk. A number of these methods are summarized for information security in the CIIP Handbook [Wenger et al, 2002] and covered extensively for general application by Haimes [1998]. Some methods, which use dollars as an analytical base, include Loss Expectancy, Risk filtering & Ranking w/ Cost Benefit, and Insurance based Actuarial methods. Another general approach is to use a relative metric to measure the value of applying countermeasures to patch the vulnerabilities in systems. Using a relative metric has a drawback in that you must first have base against which your metric can be compared. Specific methods for infrastructure organizations to evaluate their risk posture have been provided by Sandia Labs (RAM-D and RAM-T) for the Department of Energy and by the Association of Metropolitan Sewerage Agencies (AMSA) for its membership.
Most of these more accepted methods focus little on some of the more important aspects of information security modeling that were highlighted earlier including time, level of detail, and synthesis. Another method is needed to provide this added value.
A Selected Risk
Model Instantiation
There is a modeling
methodology that has the capability to answer all the issues posed previously.
It is called System Dynamics (SD) [Forrester, 1961]. This method uses a
flexible approach to represent an appropriate level of detail, to synthesize
variables and to incorporate the dynamics of changing model variables.
Fundamentally SD uses two connected entities: levels and rates, also known as
stocks and flows. Stocks represent quantities of tangible and/or intangible
entities. The symbol for a stock is a rectangle. Typical examples of stocks
include people, dollars, computers, morale, attitude, and risk. Flows are
equivalent to valves, that is a device the setting for how much quantity may
flow into or out of a stock in a given time period.
The diagrams below
portray simple stock and flow scenarios. Stocks and flows run in a simulation
environment where they can take on different values each period. The level of
people in a stock may be 100 the first period and 110 the second. The rate of
change in flows into a stock may be a constant e.g. increasing at 10 units per
period, or a variable, e.g. 20% of the previous period’s level. Other constants
or variables that may impact the environment are represented by circles.
|
|
|
Figure 2 - Stock and Flow Diagrams
In the left diagram above, the number of attacks will increase based upon
a function of the number of threats. Conversely the number of attacks expected
each period will decrease based upon countermeasures put in place such as
firewalls, antivirus and user training. How many countermeasures might be put
in place is affected by the organization’s budget for security. In the right
diagram the security knowledge in an organization will increase as personnel
are trained, and will decrease as users gradually forget what they have learned
or as new software is installed and their previous knowledge obsolesces.
The values of the variable stocks and flows are computed each period
through simultaneous difference equations. The equations for the Number of
Attacks example follow in Figure 3.
Figure 3 - Relationship of Variables
These
relationships would need to be defined by experts and by personnel with
organizational knowledge. Typical instantiation would include for example, that
one-third of an end user’s security knowledge declines over a one-year period.
And that the use of a well configured Intrusion Detection System such as Snort
contributes to an overall decrease in the number of attacks by 10% per year.
While it could be argued that defining these relationships is difficult, this
type of knowledge is necessary for an information security manager to justify
his/her allocation of resources.
Output from an SD simulation is typically expressed by a “Behavior over Time” graph such as the one below. This graph depicts the relationships among the variables of Threats, Attacks, and Budget over a 12-month period. By viewing these relationships it can hypothesized as to what possible modifications may be beneficial to the system. In this rare case it appears that the organization should consider reducing and varying the security budget to handle peak periods.
Figure 4 - Behavior Over Time Graph
System
Dynamics models may be expanded and then aggregated into “sectors” to allow a
user and/or modeler to better understand the scope of the problem. The sectors
in the macro model below mimic the semantic network as defined in the
Figure 5-
Infrastructure Model
The time period of interest in an SD model, called delta time (dt), is a
flexible feature. This time period may be set as a micro-second or as a year,
what ever best suits the particular scenario under observation. In a water
system for example a delay of a few minutes in the opening or closing of a gate
may have little overall effect upon the overall system health, so the dt may be
set as one minute. In an electric transmission system such a delay may have
serious consequences including the buildup of current and an explosion,
therefore dt would need to be set at a much smaller value such as one second.
Tangible Representation System Dynamics Sectors can represent very specific,
tangible entities and relationships. The example below, an Assets Sector, provides a view of
the interconnection between computer/SCADA network assets and physical valves
and water levels. The upper portion portrays the electronic components of the
system and the bottom portion portrays the physical assets. Feedback is
shuttled among sensors, Remote Terminal Units and gates. The presence or
absence of a firewall in this environment would provide a vulnerability
indicator.
Abstract Representation One of the sectors associated with the
countermeasures portion of the model, People Countermeasures, may be seen below. This sector can be seen
to contain abstract qualitative entities such as “knowledge” and
“satisfaction.” These metrics can be established through surveys or perhaps
through a point system applied to factors such as training and the state of the
job market.
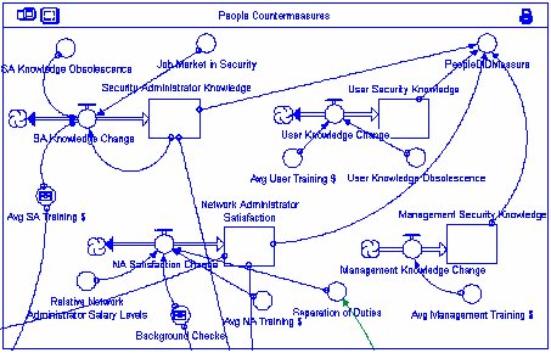
Figure 6
- People Countermeasures Sector
Relationships among variables in any SD simulation are cumulative, may
run across sectors, and are indicated through the arrows in a diagram. A good
example is presented by following a thread from Figure 6 down into Figure 7
below. In the above diagram an arrow emanates directly down from Security Administrator Knowledge (SAK)
in the People
Countermeasures sector into the Intrusion
Detection Analysis (IDA) variable under Process Countermeasures. Intrusion Detection Analysis is also
affected by IDS Knowledge Gain (IKG) in
the Technology
Countermeasures sector.
IDA = SKA * IKG; IDA ≤ 100
Stated as prose, the Intrusion Detection capability of an organization is
affected by both by installing IDS technology and by the educated ability of
the information security staff to use it.
The Technology
Countermeasures sector
in Figure 7
presents an interesting study. The effectiveness of firewall technology is
influenced by cost, by obsolescence and by the need for programming. The
ability to program a firewall is influenced by configuration management efforts
which are in turn influenced by the knowledge of information security
personnel.
Figure 7
- Process and Technology Countermeasure Sectors
A Risk Metric
A high level goal for users of this model is to minimize residual risk in their organization. Residual risk is that portion of risk that remains after security measures have been applied. It is the level of danger that a person or organization is willing to accept. Figure 8 portrays residual risk stock in the Risk Sector. As portrayed, “Residual Risk” is increased by rising insider and outsider threats multiplied by vulnerabilities arising from the Assets Sector (not shown). It is decreased by applying appropriate countermeasures indicated previously in Figures 6 and 7 including “People, Process, and Technology” Defense. Ideally residual risk is zero. It is up to the decision maker to make decisions as to how the factors effecting risk should be controlled. The model provides a sensitivity analysis (“what if”) framework.
Ultimately the organization needs to be concerned with the overall effectiveness of countermeasures against threats and vulnerabilities. While the complete elimination of risk is not possible, the manager should attempt to lower the mark as much as possible yet remain within the economic, political, cultural and technological constraints imposed upon him. For given resources there will be multiple possible solutions lying on the Pareto optimal frontier.
Figure 8 - Residual Risk
A more complex variation of this model would be to match
countermeasures one for one against vulnerabilities. Much of the knowledge and
insights gained from a model such as this comes from the modeling effort.
Organizational personnel gain insights into leverage points by capturing the
complexity of this large network of interrelating factors.
Summary
The movement of infrastructure organizations toward greater levels of
standardization is bringing increasing levels of threats and vulnerabilities.
The importance of timely reaction to attacks is particularly important in this
environment. Countermeasures are available, but the challenge for
infrastructure organizations is to best apply these with the limited resources
they have available. Better methods are needed for justifying the added
protection.
A system dynamics framework has been presented which is capable of moving
beyond traditional risk assessment models. This system-focused framework
provides the ability to focus on the issues of time, level of detail
representation, and synthesis in information security. Details of a model were
provided with an associated explanation of the modeling elements of stocks,
flows and causal effects. Further study to validate the effectiveness of this
proposed model against more traditional methods such as Cost Benefit using
Annual Loss Expectancy is needed.
References
“Asset Based Vulnerability Checklist.” (2002). Association of Metropolitan Sewerage Agencies. Washington, D.C.
Common Criteria for Information Technology Security Evaluation: (1999).Part 1 Introduction and General Model, version 2.1 CCIMB 99-031 August.
Ezell, B. Farr, J. and Wiese, I. “Infrastructure Risk Analysis Model.” (2000). Journal of Infrastructure Systems. September.
Forrester, Jay. (1961).Industrial Dynamics. Pegasus Communications, Williston, VT.
Haimes, Yacov. (1998). Risk Modeling, Assessment, and Management. Wiley. New York.
Longstaff, T. Chittister, C., Pethia, R. and Haimes, Y. (2000).“Are We Forgetting the Risks of Information Technology?” IEEE Computer December.
U.S. Department of
Energy: Office of Energy Assurance.(2002). “21 Steps to Improve Cyber Security
of SCADA Networks.” September.
Wenger, A. Metzger, J. and Dunn, M. Editors. (2002). International Critical Information Infrastructure Protection Handbook. Appendix A1 Glossary of Terms.